
Diving into election finances
Posted by JamesAfter talking to the electoral commission yesterday, I got interested in what local candidates normally spend on their campaigns.
Fortunately, this is all open data. The Electoral Commission publish the statistics about election spending on their website, all under the Open Government License. All figures in this article come from them.
There is one particular dataset which we’ll dive into here; the candidate spending in the 2010 general election. This lists all candidates in the general election of 2010, what they spent, what they raised, and even better, what the split of spending was. It also includes the number of votes they gained, so you could do some handy analysis of spending vs seats gained, perhaps. There’s lots of data in there, so what follows are excerpts, not the whole lot.
Total spending
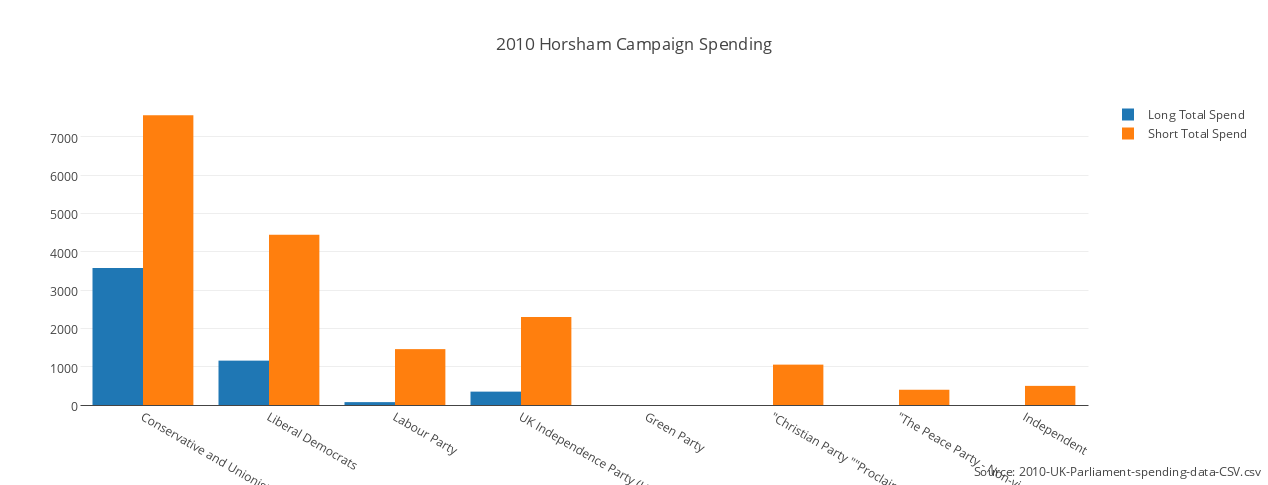
Let’s look at campaign spending first.
We had 8 candidates in the last election. During the long campaign (see yesterday’s post), they were allowed to spend £30,429.48. During the short campaign, they were allowed to spend £12,579.48.
| Party | Votes | Long Campaign Spend | Short Campaign Spend | |
|---|---|---|---|---|
| Conservatives | 29,447 | £3,577.41 | £7,564.69 | |
| Lib Dems | 17,987 | £1,158.83 | £4,446.94 | |
| Labour Party | 4,189 | £75.75 | £1,460.67 | |
| UKIP | 2,839 | £350.00 | £2,299.20 | |
| Green Party | 570 | £0.00 | £0.00 | |
| Christian Party | 469 | £0.00 | £1,056.50 | |
| Peace Party | 253 | £0.00 | £400.00 | |
| Independent | 87 | £0.00 | £501.09 |
So, what can we learn from this?
-
The total cost of the campaign was not much over £11k for the highest-spending party. That’s reassuring.
-
None of them spent anywhere near the maximum allowed.
-
Most of the spending happens in the short campaign; this makes sense, as that’s when your mailouts happen, etc.
-
The Green Party spent nothing. That explains why I never got a leaflet telling me about the candidate. I’m going to ignore anyone else who suggests I’ll split their vote now, as they quite obviously aren’t interested here.
Where does the money go?
Let’s dig into a bit more detail on what that money is spent on. We’ll just look at the Conservatives here, as they have the largest spend.
| Category | Spend | |
|---|---|---|
| Advertising | £966.32 | |
| Leaflets | £4,897.67 | |
| Staff | £4,177.63 | |
| Accommodation | £1,100.48 |
This is really interesting for my planning. The actual cost of getting a leaflet to (presumably) every home in the constituency (which has 77,000 voters) is under £5k. That’s a lot less than I expected, and should totally be crowdfundable. That’s verified by the other parties as well - the Lib Dems spent a similar amount.
Learning more
This has given me some really useful insights. I’d recommend having a dig into the figures for your area as well, you might find something interesting! I think this could be a good data-driven website as well - exposing this stuff through a nice data visualisation would be lovely; maybe a project for Democracy Club?
You can dig into the data at the link above, and this guide from the Electoral Commission gives lots more detail on what it all means. It’s for the 2014 EU elections, but the concepts are the same, so it’s a decent reference. I’ll be digging more into that guide as I go along, sorting out my own finances, so more of this to come.
Until next time…
Comments
Add a comment